Download to read offline

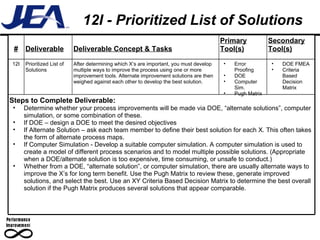
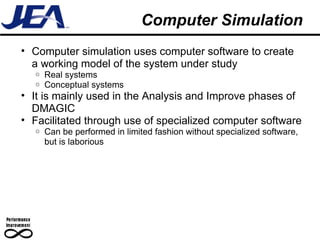
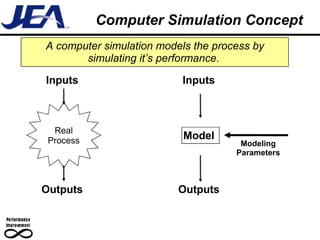
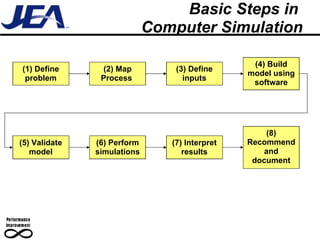
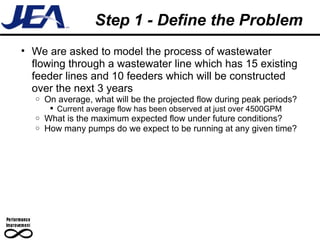
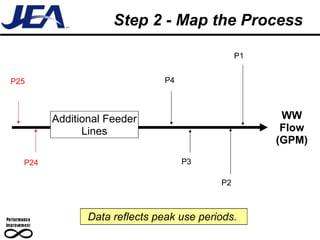
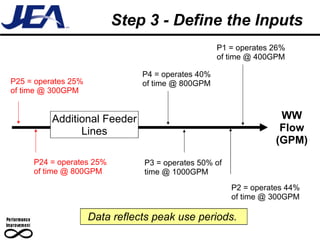


The document discusses computer simulation as a tool for process improvement. It defines computer simulation as using a computer model to simulate a real system. The basic steps for computer simulation are: 1) define the problem, 2) map the process, 3) define inputs, 4) build the model, 5) validate the model, 6) perform simulations, 7) interpret results, and 8) recommend and document solutions. Reasons for using simulation include testing changes without risk or time constraints, understanding bottlenecks, and validating expected improvements. Simulation should not be used without proper training or understanding, or when simpler methods can achieve the goal.